1. Soil Degradation
Estimating desertification risk with remote sensing
Desertification risk maps are maps that portray the probablity of desertification progressing in the areas covered by the map. The risk is calculated using various indicators, similar to those used with the USLE/RUSLE models. An additional factor that plays very important role in the progression of desertification, is soil moisture. When the soil is capable of witholding water (which is the case when there is more clay than sand in the soil), the risk for desertification is lower. Water availability is a crucial factor for the growth of vegetation, which restricts desertification and soil erosion in general. Temperature, is another factor that is particularly important for this form of soil erosion, as it increases evaporation and promotes drought conditions.

Source: Natural Resources Conservation Service of the U.S. Department of Agriculture (1999)
The three main indicators used for the assessment of desertification from remote sensing are vegetation cover, land surface temperature (LST) and soil moisture. Land surface temperature is estimated using thermal bands of satellite imagery. The thermal bands are located at atmospheric windows in the infra-red regions of the electromagnetic spectrum. By using Plank's Law it is possible to calculate the temperature of a surface, based on the amount of energy that this surface is emitting.
Soil moisture can be estimated from radar images. Radar images are a product of active remote sensing, as a pulse is emitted at a particular wavelength and the reflected signal is then recorded by the sensor (see more information on radar here). The radar signal at particular wavelengths is affected by the dielectric constant of the material it interacts with. As soil moisture increases, so does the electrical conductivity of the soil. Taking advantage of this characteristic allows us to estimate soil moisture from radar.
Vegetation cover can also calculated from remotely sensed images, by using vegetation indices which represent the amount of vegetation or the area covered by vegetation. The selection of the vegetation index usually depends on the type of vegetation in question, and in most cases, the simple NDVI index or some derivative of it (such as the SAVI, TSAVI or others) is used.
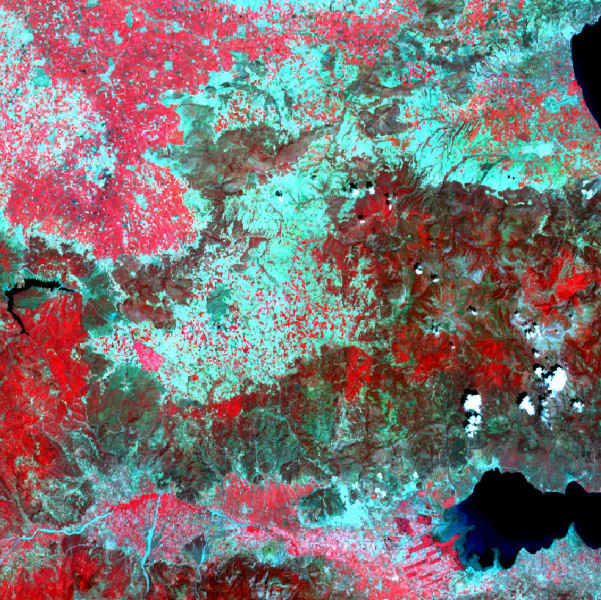
The image above is a false-colour image portraying agricultural fields on the top left corner. Areas that are covered with vegetation appear red, because vegetation has high reflectance in the near infrared region of the spectrum, which appears with the red colour. Generally, bright red areas are covered by healthy, vibrant vegetation, whereas dark red areas portray old vegetation vegetation, near the end of its growth season. In this image, dark red areas are forests, growing on the side of the mountain ridges. Fallow land that has no vegetation appears blue because soil has low reflectance in the near infrared.
Healthy and thick vegetation has high near infrared reflectance and low red reflectance. As plants approach senescence, the near infrared reflectance decreases and because chlorophyll begins to break down, red reflectance increases. This characteristic is used in some vegetation indices, to estimate (among other things) vegetation cover. Those indices combine the reflectance in the near infrared and the red regions of the spectrum (such as NDVI or SAVI) to produce one value, representative of the vegetation cover. These values are used as the vegetation cover indicator when desertification risk is calculated.
