10. Image Credits
1. Motivation and Introduction
|
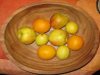
A bowl of fruit
|
|
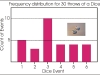
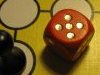
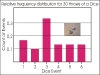
Two dice / Frequency distribution for 30 throws of a dice
|
|
Frequency distribution for a sample of 754 school students
|
|
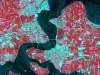
A false colour composite image of the Middelfart - Fredericia area of Denmark,
acquired by the Landsat TM satellite
Date of aquisition: 03.06.2004 |
2. Mathematical Methods
|
|
One dice / Frequency distribution for 30 throws of a dice
|
|
|
Frequency distribution for a sample of 754 school students
|
|
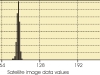
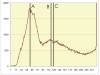
A frequency distribution for one training area on one cover type
|
|
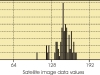
A frequency distribution for one training area on another cover type
|
|
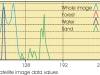
Frequency distributions for the whole of the Skagen image and for the three training areas
|
|
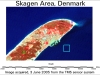
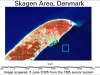
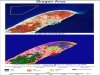
Landsat TM5 image of the Skagen area of Denmark
Date of aquisition: 03.06.2004 |
|
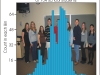
Sample distribution
|
|
Landsat TM5 image of the Skagen area of Denmark
Date of aquisition: 03.06.2004 |
|
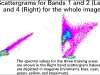
Scattergrams for bands 1 and 2 on the left and bands 1 and 4 on the right for the image above
|
|
One dice
|
|
Possible outcome of two throws of a dice
|
|
|
Histogram of throws of dice
|
|
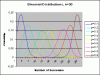
Binomial Distribution for n = 30 showing how the shape changes as the probability of an event changes
|
|
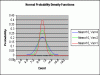
Normal Probability Distribution Functions
|
3. What is Classification?
|
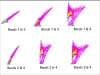
Typical scattergrams for 4 band satellite image data
|
|
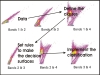
The process of classification I
|
|
The process of classification II
|
|
The physical meaning of the land cover classes depicted in one of the scattergrams depicted on this page
|
4. The Minimum Distance Classifier
|
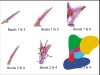
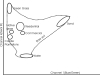
Three classes, their Euclidean Distances and their Minimum Distance Decision Surfaces
|
|
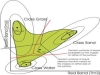
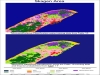
Skagen image, training areas and Minimum Distance Classification
|
5. The Maximum Likelihood Classifier
|
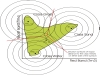
Scattergram depicting three class means, their distribution in units of standard deviation, and class decision surfaces
|
|
Skagen area, minimum distance and maximum likelihood classification
|
6. Errors and Costs in Classification
|
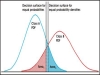
Two classes in one dimension, their normal distributions and two possible decision surfaces
that could be sued to discriminate between objects in the two classes
|
