2. Introduction into the Mathematical Methods
The normal distribution
Many types of data have values that occur over a continuous range of values. Such data are called continuous data. For such data the Binomial distribution is not suitable.
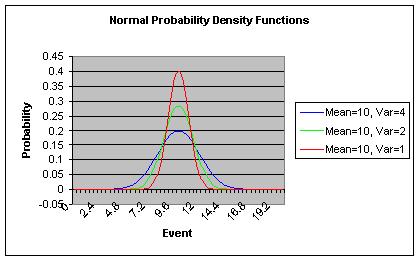
The normal distribution has been shown to be suitable for many applications involving continuous data. The Normal distribution has the advantage that its shape depends only on the mean and variance parameters.
There are a number of important things that you should know about the Normal Probability Density Function:
- The Normal Probability Density Function (PDF) is a function of its mean and variance values.
- The Normal PDF has a single peak and its values are symmetrical about this peak.
- The peak of the Normal PDF is its mean value, mode and median.
- The mean value can take any numerical value; negative, zero or positive.
- The tails of the curve extend infinitely in both directions from the mean, but of course they will have very small values.
- The standard deviation determines the width and height of the curve. Larger values give wider and flatter curves.
- The point of inflection on either side of the curve is at one standard deviation from the mean value of the curve.
- The total area under the curve sums to 1.0, the same for all Continuous Probability Density Functions.
- The probabilities are given by the areas under the curve, being specified from a start to and end value. Some useful probabilities to remember are:
- 68.26% of the time, a normal random variable (x) assumes a value within one standard deviation of its mean value.
- 95.44% of the time, a normal random variable assumes a value within two standard deviations of its mean value.
- 99.72% of the time, a normal random variable assumes a value within three standard deviations of its mean value.
The equation for the Normal Probability Density Function is:
In this equation, one can see that the parameters of the equation are the mean (μ) and variance (σ2), and the one variable, x. The Standard Normal PDF with zero mean and unit variance:
Where so that a Table of Probabilities for the Standard Normal PDF can be used for any normal PDF by converting the x values for the normal PDF to z values of the Standard Normal PDF.
Questions:
- What is the probability that a value will occur within one standard deviation of the mean that is
?
Look up the Table for the Standard Normal PDF at 1.00 and you get 0.3413. This is from the centre out to one side of the distribution,
so you need to double it, to get 0.6826.
- What is the probability that a value will occur in the range 8 to 12 in the Normal PDF, N(10, 4)? Convert the x=8 and 12 to z
values first.
- What is the value of the probability,
?
- What is the value of the probability,
?
- What is the value of the probability,
?
- What is the value of the probability, ?

