2. Introduction into the Mathematical Methods
Probability density functions
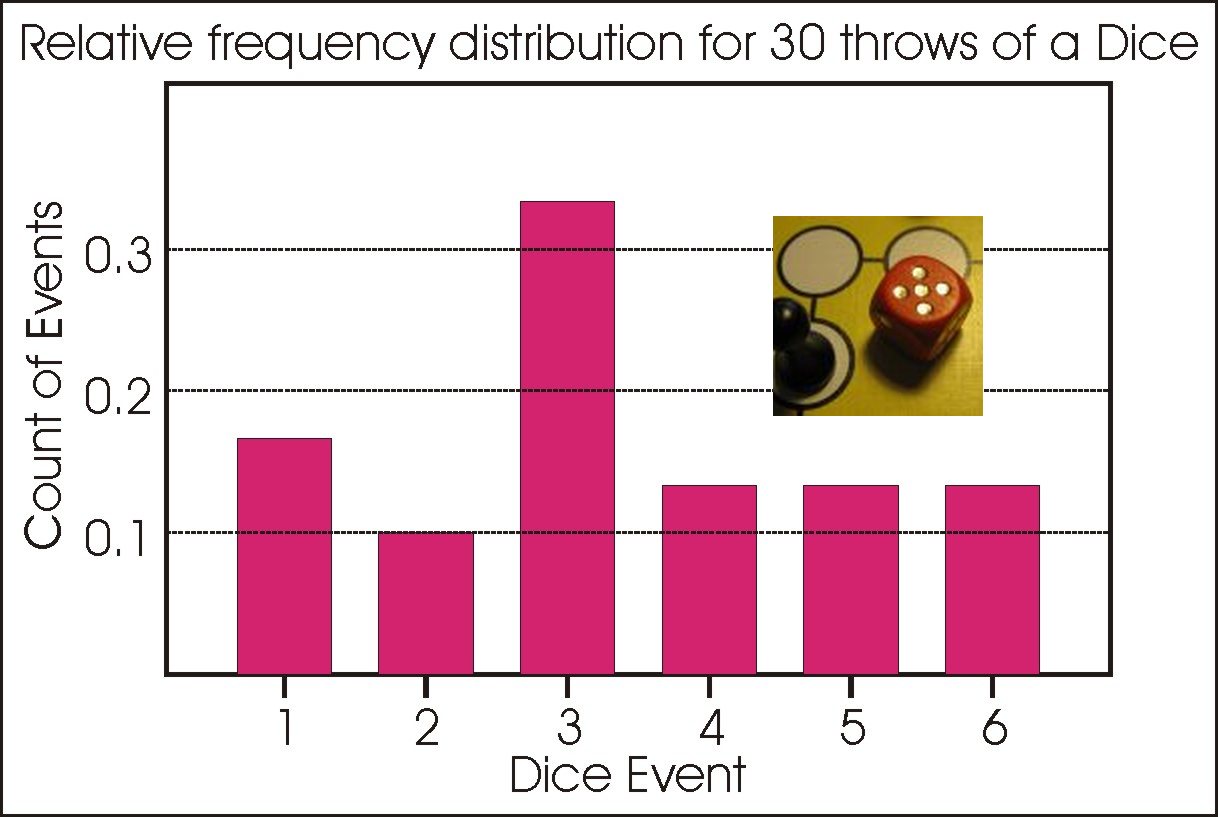
We have met sample Frequency Distributions, from each of which can be readily made a Relative Frequency Distribution or histogram depicting the proportion of throws that gave each value on the dice. A relative frequency distribution is also a sample Probability Density Function (PDF), because these proportions are also the probability of each event occurring, from the sample of data.
However, we also know that the probability of throwing any number with a dice is all equal at 1/6 for each outcome. When the probability of each event is equal, then the data has a uniform Probability Density Function and so the theoretical distribution for the throw of a dice is a uniform distribution with a value of 1/6. If we took a large enough number of samples then the probabilities derived from this sample should get close to this theoretical probability.
The Probability Density Function for a sample of data is unique to that dataset. What we usually require is a Probability Density Function that can be applied across many samples. For such a task, the Probability Density Function derived from a sample may give significant errors in any analysis and will be difficult to use for analysis. We can often find a suitable Probability Density Function either as a theoretical distribution for a set of data, or as an approximation to a set of data.
Consider a dice. Theoretically, each number has an equal probability of turning up. The theoretical Probability Density Function for the toss of a dice is thus a uniform distribution with a value of 1/6, so that 30 throws of the dice should yield 5 of each number. It has not in our sample provided in Chapter One, since our sample is just that; a sample set of data. In practice, the larger the sample, the closer it will approximate this uniform distribution.
| Value | Sample Count | Sample Probability | Theoretical Probability |
|---|---|---|---|
| 2 | 0 | 0.000 | 0.028 |
| 3 | 1 | 0.033 | 0.056 |
| 4 | 3 | 0.100 | 0.083 |
| 5 | 2 | 0.067 | 0.111 |
| 6 | 6 | 0.200 | 0.139 |
| 7 | 5 | 0.167 | 0.167 |
| 8 | 2 | 0.067 | 0.139 |
| 9 | 6 | 0.200 | 0.111 |
| 10 | 2 | 0.067 | 0.083 |
| 11 | 3 | 0.100 | 0.056 |
| 12 | 0 | 0.000 | 0.028 |
| Total | 30 | 1.000 | 1.000 |
The Probability Density Function for the throws of two dice is not a Uniform distribution, so how can we calculate it?
The probability of getting a two can only occur if a 1 is thrown with both dice. We know that the probability of throwing a 1 with one dice is (1/6), so the probability of throwing two 1's is (1/6)·(1/6) equal (1/36). You can get a three from either a 2 and a 1 or a 1 and a 2. Both have a probability of 1/36, so the two together give a probability of 2/36. You can now check the values given in the table for each other number.
Sample Probability Density Functions are of limited value in analysis because we cannot describe them accurately using a few parameters and because they will change each time a new sample is taken. With discrete events we can often derive the theoretical Probability Density Function that is applicable to the data, as has been done here for the throws of one and two dice. This is not always possible with continuous data. However, there are a few standard Probability Density Functions that have been found to be useful over a range of conditions. We are going to consider two Probability Density Functions that are widely used in the next lessons.
